Sector Performance in July 2026: IT Leads as Capital Goods and Power Lag

Sector Performance in July 2026 was mixed across the Indian stock market. IT emerged as the strongest-performing sector, while Capital Goods and Power faced notable pressure. Meanwhile, Consumer Durables, Real Estate and Auto also delivered strong gains. This wide difference in returns shows that investors were selective during the month. Instead of moving into the entire market, they appeared to focus on sectors with stronger growth expectations and market momentum. As a result, July provided an important example of why investors should track sector trends while also studying company fundamentals. July 2026 Sector Performance at a Glance The major sectors and market indices recorded the following performance in July: Sector / Index July 2026 Performance IT +14.7% Consumer Durables +9.3% Real Estate +8.6% Auto +8.0% Healthcare +3.0% Metals +1.8% Oil & Gas +1.7% BSE MidCap +1.6% FMCG +0.7% PSU +0.4% BSE SmallCap -0.1% Banks -0.2% Power -5.3% Capital Goods -5.4% The numbers show a clear gap between the leading and lagging sectors. In particular, IT gained 14.7%, whereas Capital Goods declined 5.4%. IT Sector Leads the Rally IT was the best-performing sector in July, gaining 14.7%. The strong performance suggests renewed investor interest in technology companies. Furthermore, expectations around global technology spending, artificial intelligence, cloud computing and improving sector sentiment may have supported the rally. However, investors should not judge the sector only by its monthly return. Before investing in IT stocks, investors should consider: Therefore, strong price momentum should be supported by healthy business fundamentals before it becomes a long-term investment case. Consumer Durables and Real Estate Show Strong Growth Consumer Durables gained 9.3% during July. As a result, the sector became one of the month’s strongest performers. The gain reflects continued investor interest in domestic consumption. Moreover, rising incomes, changing consumer preferences and increased spending on premium products can support long-term demand. Real Estate also performed strongly, gaining 8.6%. The sector may benefit from several factors, including: However, real estate companies remain sensitive to interest rates, property prices and economic conditions. Therefore, investors should assess individual businesses rather than treating the entire sector as equally attractive. Auto Sector Gains 8% The Auto sector delivered an 8% gain in July. Several factors can influence investor sentiment toward automobile companies. For example, improving vehicle demand, premiumisation, new model launches and electric vehicle adoption can support future growth. Additionally, growth in auto components and mobility-related businesses can create opportunities across the wider automobile ecosystem. Nevertheless, investors should examine sales growth, operating margins, raw material costs and competitive positioning before making investment decisions. Healthcare, Metals and Oil & Gas Remain Positive Not every sector experienced a sharp rally. However, several industries still ended July in positive territory. Healthcare gained 3%, while Metals and Oil & Gas increased by 1.8% and 1.7%, respectively. Although these sectors delivered positive returns, their performance remained well below the gains seen in IT, Consumer Durables, Real Estate and Auto. This difference suggests that the market rally was selective. In other words, investors appeared to prefer certain growth themes instead of buying across every industry. Banking and Small-Cap Segments Remain Flat The BSE SmallCap index declined marginally by 0.1%. Meanwhile, the banking sector fell 0.2%. Both movements were relatively small compared with the sharp gains and losses seen elsewhere. Therefore, the data suggests that investors were cautious about some market segments. At the same time, they were willing to allocate capital toward sectors showing stronger momentum. For investors, this is an important reminder that overall market performance does not always reflect what is happening across individual sectors. Power and Capital Goods Face the Biggest Pressure Capital Goods and Power were the weakest performers in July. Capital Goods declined 5.4%, while Power fell 5.3%. The weakness is notable because both sectors are closely linked to India’s infrastructure and investment cycle. Consequently, their decline may attract attention from investors who have a long-term view of India’s capital expenditure story. However, a weak monthly performance does not automatically mean that the long-term outlook has changed. Several factors can influence short-term sector movements, such as: Therefore, investors should determine whether the decline is simply a price correction or a sign of weakening business fundamentals. What Does July’s Sector Performance Tell Investors? The July data highlights three important market trends. 1. Market Leadership Was Concentrated IT, Consumer Durables, Real Estate and Auto recorded the strongest gains. Therefore, investors were not buying the entire market equally. Instead, capital appeared to move toward selected sectors with stronger momentum. 2. Domestic Themes Remained Important Consumer-focused sectors and Real Estate continued to attract investor attention. Moreover, these industries can benefit from rising domestic demand, urbanisation and improving economic activity. 3. Sector Rotation Is Visible The difference between IT’s 14.7% gain and Capital Goods’ 5.4% decline is significant. As a result, sector rotation has become an important factor for investors to monitor. Money can move from one industry to another as valuations, earnings expectations and market sentiment change. Should Investors Chase the Best-Performing Sectors? A sector that performs well in one month does not automatically become the best investment for the next month. For this reason, investors should avoid buying stocks simply because they have recently delivered strong returns. Instead, evaluate the following factors. Earnings Growth First, examine whether revenue and profit growth can continue. Strong earnings can provide better support for long-term valuations. Valuation Next, compare the current valuation with the company’s earnings potential and historical levels. A strong business can still become expensive after a sharp rally. Balance Sheet Strength Additionally, review debt levels, cash flows and interest costs. Companies with stronger balance sheets may be better positioned during difficult market conditions. Return Ratios Metrics such as ROE and ROCE can help investors understand how efficiently a company uses its capital. Industry Outlook Furthermore, consider whether the sector’s growth is driven by long-term structural changes or short-term market sentiment. Management Quality Finally, investors should examine management quality, promoter holdings and corporate governance before taking an investment decision. How Investors Can Use Sector Trends Sector performance

BSE: More Than Just a Stock Exchange – Understanding India’s Financial Powerhouse

BSE More Than Just a Stock Exchange is an idea every investor should understand before evaluating India’s capital market ecosystem. While most people recognize the Bombay Stock Exchange (BSE) as a platform for buying and selling shares, its role extends far beyond stock trading. Today, BSE operates as a diversified financial infrastructure company that earns revenue from multiple business segments and benefits from India’s rapidly growing investment culture. With more retail investors entering the market, increasing IPO activity, and expanding derivatives trading, BSE has emerged as one of the country’s most important financial institutions. Understanding its business model, growth drivers, and future opportunities can help investors better evaluate its long-term potential. What Is BSE? The Bombay Stock Exchange (BSE) is Asia’s oldest stock exchange and one of the world’s leading financial marketplaces. Established in 1875, it provides a transparent and regulated platform where investors can trade a wide range of financial instruments. These include: Unlike manufacturing companies that generate revenue by selling products, BSE earns income by facilitating capital market transactions and offering financial market services. A Legacy of More Than 150 Years BSE has played a significant role in India’s financial development for over a century. Its journey reflects the evolution of the country’s capital markets. 1875 – Establishment The Bombay Stock Exchange was founded, becoming Asia’s first organized stock exchange. 1957 – Official Recognition BSE received recognition under the Securities Contracts (Regulation) Act, strengthening investor confidence and regulatory oversight. 1986 – Launch of Sensex BSE introduced the Sensex, India’s benchmark stock market index that tracks the performance of leading listed companies. 1995 – Electronic Trading The introduction of the BOLT (BSE On-Line Trading) system replaced manual trading with electronic transactions, improving efficiency and transparency. 2017 – Public Listing BSE became a listed company, allowing investors to participate in the growth of the exchange itself. 2018 – India INX The exchange expanded internationally by launching India INX at GIFT City, strengthening India’s position as a global financial hub. 2023–2026 – Accelerated Growth The surge in retail participation, IPO launches, and derivatives trading has significantly boosted BSE’s business performance. Strong Financial Performance BSE has reported impressive financial growth in recent years. Revenue Net Profit Market Capitalization Valuation These figures highlight how stock exchanges benefit from increasing investor participation and higher trading volumes. How Does BSE Generate Revenue? Many investors assume that stock exchanges earn money only through trading fees. In reality, BSE operates multiple revenue-generating businesses. 1. Equity Trading Every buy and sell transaction executed on the exchange generates transaction fees. As market participation grows, trading volumes increase, contributing to higher revenue. 2. Listing Services Companies raising capital through public markets pay listing-related fees. This includes: India’s strong IPO pipeline has become a major contributor to BSE’s revenue. 3. Market Data and Index Services BSE licenses valuable financial information to institutional investors and financial service providers. Its offerings include: These services provide recurring revenue and strengthen the exchange’s business model. 4. Derivatives Business BSE has expanded its presence in derivatives trading. Products include: Growing participation in derivatives has significantly improved profitability and diversified revenue sources. 5. Depository Investment BSE owns a strategic stake in Central Depository Services Limited (CDSL). As the number of Demat accounts continues to rise across India, this investment provides long-term value and supports future earnings growth. Why Is BSE Growing Rapidly? Several structural trends are driving the exchange’s long-term expansion. Rising Retail Participation Millions of first-time investors have entered India’s financial markets. This has resulted in: Strong IPO Market India has witnessed consistent IPO activity in recent years. Every successful listing generates fees while increasing future trading volumes. Growth in Derivatives The derivatives segment has expanded rapidly, creating additional revenue opportunities without proportionately increasing operating costs. Digital Investing Online brokerage platforms and mobile investment apps have made investing easier than ever before. This digital transformation continues to bring new participants into the capital markets. Why Is BSE Considered a High-Margin Business? Stock exchanges operate highly scalable business models. Once the technology infrastructure is established: This operating leverage allows exchanges to generate strong profitability during periods of rising investor participation. Key Strengths of BSE Several competitive advantages support BSE’s long-term growth. Established Market Presence With over 150 years of history, BSE enjoys exceptional credibility among investors. Large Number of Listed Companies More than 5,600 companies are listed on the exchange across various sectors. Strong Brand Recognition The Sensex remains one of India’s most widely tracked stock market indices. Diversified Revenue Sources Income is generated from trading, listings, market data, derivatives, and strategic investments. Strategic Investment in CDSL Its stake in India’s leading depository adds another valuable earnings stream. Beneficiary of India’s Financial Growth Increasing financial awareness and higher participation in capital markets support long-term business expansion. Risks Investors Should Consider Although BSE has strong growth prospects, investors should evaluate the associated risks. Some key challenges include: A balanced investment decision requires understanding both opportunities and risks. Future Growth Outlook India’s capital markets are expected to expand significantly over the coming decade. Key growth drivers include: As these structural trends continue, exchanges like BSE are well positioned to benefit from sustained growth in market activity. Why Investors Track BSE as a Business BSE is not merely a marketplace for securities—it is a company that benefits directly from the expansion of India’s financial ecosystem. Its diversified operations, strong profitability, scalable business model, and strategic investments make it one of the country’s important financial infrastructure businesses. Investors often monitor factors such as: These factors influence the exchange’s long-term business performance. Final Thoughts BSE More Than Just a Stock Exchange perfectly describes the transformation of India’s oldest exchange into a diversified financial infrastructure company. Beyond facilitating stock trading, BSE generates revenue through listings, derivatives, market data services, index licensing, and strategic investments, making it an integral part of India’s capital market ecosystem. As India’s investment landscape continues to expand, BSE is expected to benefit from increasing retail participation, rising IPO activity, and the ongoing digitalization of financial services. However, investors

Debt-Free Companies vs Low-Debt Companies: Which Investment Choice Is Better?

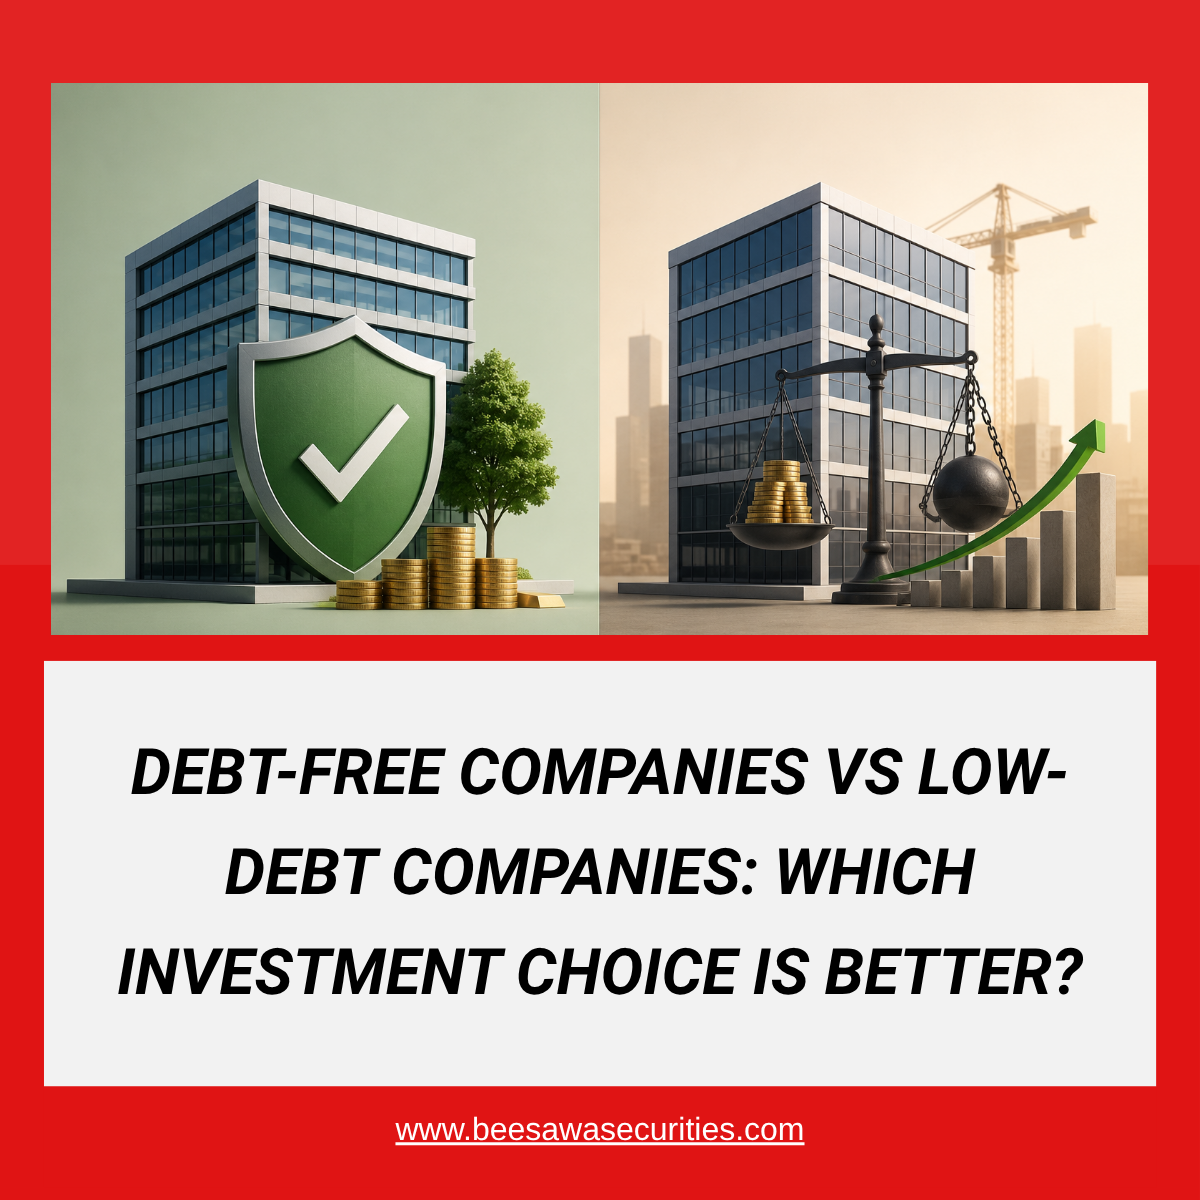
Debt-Free Companies vs Low-Debt Companies is a common debate among investors looking for financially strong businesses. Many believe that companies with zero debt are always the safest investments, while others argue that businesses using debt wisely can deliver superior returns. The truth lies somewhere in between. Instead of judging a company solely by the amount of debt it carries, investors should understand how efficiently that debt is managed and whether it contributes to long-term value creation. This article explains the difference between debt-free and low-debt businesses, their advantages, risks, and the financial metrics investors should evaluate before making an investment decision. What Is a Debt-Free Company? A debt-free company has no significant short-term or long-term borrowings on its balance sheet. Instead of relying on loans, it finances operations through internal cash generation, retained earnings, or equity capital. Such companies usually generate sufficient cash to fund expansion without depending on external lenders. Key Characteristics These businesses are generally viewed as financially stable because they have fewer obligations during uncertain economic conditions. Advantages of Debt-Free Companies 1. Lower Financial Risk Without loan repayments or interest expenses, these companies face less financial pressure during slow economic periods. They can continue operating smoothly even when revenue growth slows. 2. Higher Profit Retention Interest expenses reduce net profits. Since debt-free businesses have no borrowing costs, a larger portion of earnings remains available for: 3. Strong Performance During Economic Slowdowns During periods of rising interest rates or weak demand, companies carrying heavy debt often struggle. Debt-free businesses usually remain more stable because they are not burdened with mandatory repayments. 4. Greater Strategic Flexibility Management can make long-term business decisions without restrictions imposed by lenders or financing agreements. Limitations of Debt-Free Companies Although financially strong, companies with no borrowings are not always the best investments. Slower Expansion Businesses relying only on internal cash flows may take longer to expand compared to competitors using affordable financing. Missed Growth Opportunities Debt can sometimes help companies invest in profitable projects much earlier than they could using retained earnings alone. Avoiding debt completely may limit future growth. Premium Valuations Financially strong businesses often trade at higher valuations because investors value their stability. Buying an excellent company at an expensive price may still result in lower future returns. What Is a Low-Debt Company? A low-debt company uses borrowing conservatively while maintaining sufficient cash flow to comfortably repay its obligations. Rather than avoiding debt completely, these companies use financial leverage to support expansion and improve shareholder returns. Common uses of debt include: The emphasis is on manageable debt rather than zero debt. Advantages of Low-Debt Companies 1. Faster Business Growth Borrowed capital allows businesses to expand without waiting years to accumulate internal funds. This can help companies capture market opportunities more quickly. 2. Improved Shareholder Returns When a company earns more from its investments than it pays in interest, debt can enhance Return on Equity (ROE). This efficient use of capital often benefits shareholders. 3. Tax Efficiency Interest expenses are generally tax deductible, reducing taxable income and improving overall profitability. 4. Better Capital Utilisation Instead of exhausting internal cash reserves, businesses can preserve liquidity while financing growth through reasonably priced borrowing. Risks of Low-Debt Companies Even moderate borrowing requires careful management. Rising Interest Rates Higher borrowing costs can reduce profitability and cash flows. Weak Business Performance If revenues decline significantly, loan repayments become more difficult. Aggressive Expansion Borrowing excessively without generating adequate returns can destroy shareholder value. Therefore, investors should always assess whether debt supports productive growth. Debt-Free vs Low-Debt Companies: A Comparison Factor Debt-Free Company Low-Debt Company Financial Risk Very Low Low Growth Potential Moderate Higher Interest Expense None Limited Stability During Downturns Excellent Good Capital Efficiency Moderate High Return Potential Stable Potentially Higher Bankruptcy Risk Very Low Low (if debt is managed well) Both business models have strengths. The better investment depends on how effectively management allocates capital. Financial Ratios Every Investor Should Evaluate Looking only at total debt can be misleading. Instead, investors should analyse multiple financial indicators. Debt-to-Equity Ratio This ratio compares total debt with shareholders’ equity. General guidelines include: Industry context remains important. Interest Coverage Ratio This measures a company’s ability to pay interest using operating earnings. A higher ratio generally indicates stronger financial health. Debt Service Coverage Ratio (DSCR) DSCR evaluates whether operating cash flow is sufficient to meet total debt obligations. Higher values suggest stronger repayment capacity. Operating Cash Flow Healthy cash generation is often more important than having zero debt. Companies with strong operating cash flow are generally better positioned to repay loans and continue investing in future growth. Return on Capital Employed (ROCE) ROCE measures how efficiently a company generates returns from the capital employed. Ideally, ROCE should consistently exceed the company’s borrowing cost. When this happens, debt contributes positively to shareholder value. Why Industry Comparison Matters Debt levels vary significantly across industries. Capital-Intensive Industries Businesses such as: typically require substantial borrowing due to heavy capital expenditure. Moderate debt is often considered normal. Asset-Light Industries Sectors such as: usually require less capital investment. High borrowing in these industries may require closer examination. Therefore, investors should compare companies with industry peers rather than applying a universal standard. When Can Debt Be Beneficial? Debt becomes valuable when it is used responsibly. Positive signs include: In such situations, borrowing can accelerate business growth without creating excessive financial risk. Warning Signs Investors Should Watch Before investing, pay attention to these red flags: These indicators may suggest weakening financial health. Investment Checklist Before Buying a Stock Before investing in any company, ask the following questions: Positive answers to these questions often indicate responsible financial management. Final Thoughts Debt-Free Companies vs Low-Debt Companies should not be viewed as a battle where one category always wins. Debt-free businesses offer stability, lower financial risk, and resilience during challenging economic periods. On the other hand, companies with manageable debt can grow faster, improve capital efficiency, and create greater shareholder value when borrowing is used wisely. Instead of focusing solely on whether a